
You’ve just finished training a credit risk tree model with a whooping 57 AUC score, and you feel great. And you should. But let’s dig deeper. How much better will this model be than using no model? Or than using the previous model which had an AUC of 48?
Have you ever wondered what the impact of an algorithm you are building is? How much money you are making for your company? How many lives are our campaigns saving?
Every member of an organization should know how their actions contribute to the organization’s goals. This allows them to prioritize and be more efficient in their work.
The impact of an algorithm is tied to the actions it enables
To estimate the impact of an algorithm, first, we’ll need to define a metric. This will usually be money because it’s the main human mean of value exchange and one of the main goals of businesses. However, depending on the nature of your project, you can use metrics such as lives or time saved.
To estimate the impact of an action, we have to calculate the difference of our metric between two different scenarios:
- The current outcome (measured in the metric we’ve defined). This can be 0 if nothing can be done without the algorithm
- The outcome we expect to get by using the algorithm instead
Building simplified models of the situation will allow us to make estimations of the impact. This is similar to how we would build a business case.
Let’s make it more clear with an example
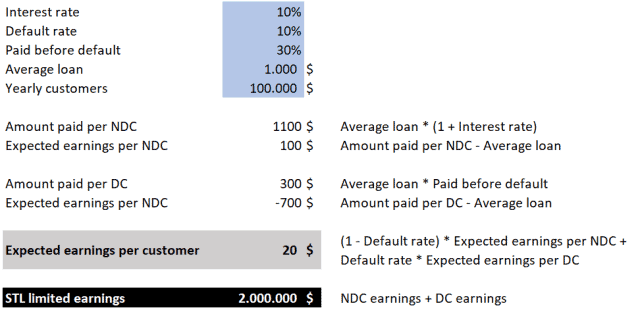
STL limited (Short Term Loans) is a credit company that gives 1-year loans. This is how their business is going:
- They give loans at a 10% interest rate to everyone that applies for one
- Their default rate is 10% (percentage of customers that don’t pay back all the money they owe)
- Customers that default had paid back an average of 30% of the loan amount before defaulting
- The average loan amount is 1.000$
- Every year 100.000 new customers apply for a loan
With this information we can estimate how much they currently earn per year by using a simple excel spreadsheet. We will first estimate the expected earnings per non-defaulting customer (NDC) and per defaulting-customer (DC). After this we will combine those estimations to calculate the expected value per customer by using conditional probabilities.
Building a model to improve earnings
John, the lead data scientist at STL limited, has developed a probability of default model. He has trained it using customer employment data that was collected anyway for regulatory reasons.
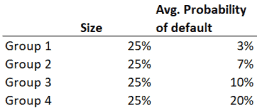
John uses the model to make predictions on a holdout set (a dataset that the model has never seen before). He then divides the customers into four groups of the same size based on the probability of default predictions. The following table shows the probability of default for each of the groups:
Modifying the default rate on the previous spreadsheet, we can estimate the expected earings per customer for each of the groups:
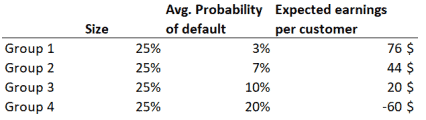
The average customer on group 4 loses money for STL limited.
How would much would STL limited earn if they only gave credit to people on groups 1, 2 and 3?
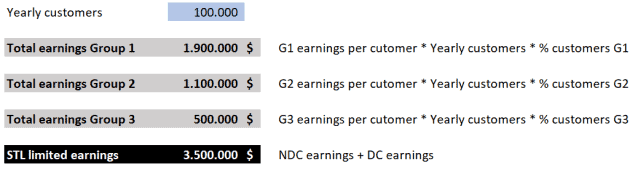
By only giving credit to customers with positive expected earnings, STL could make a total of 3,5M$ per year. This means that the model would have an impact of 1,5M$ (3,5M$ minus the 2M$ of the base case).
Wrapping it up
This impact estimation method is based on simplification and it leaves out second-order consequences of the actions. Additionally, future performance isn’t guaranteed to be the same as in the past. To account for these sources of uncertainty, I generally multiply the impact estimation by a conservative factor of 50-80%.
Nevertheless, the objective of these estimations is not perfect accuracy but getting a ballpark figure that will allow us to compare and prioritize.